


Portfolio Details
A structured cheat sheet for writing efficient and scalable DAX measures.
Project Information
- Name: Power BI DAXpedia Dashboard
- Category: Dashboard Development
- Project URL: View on Github
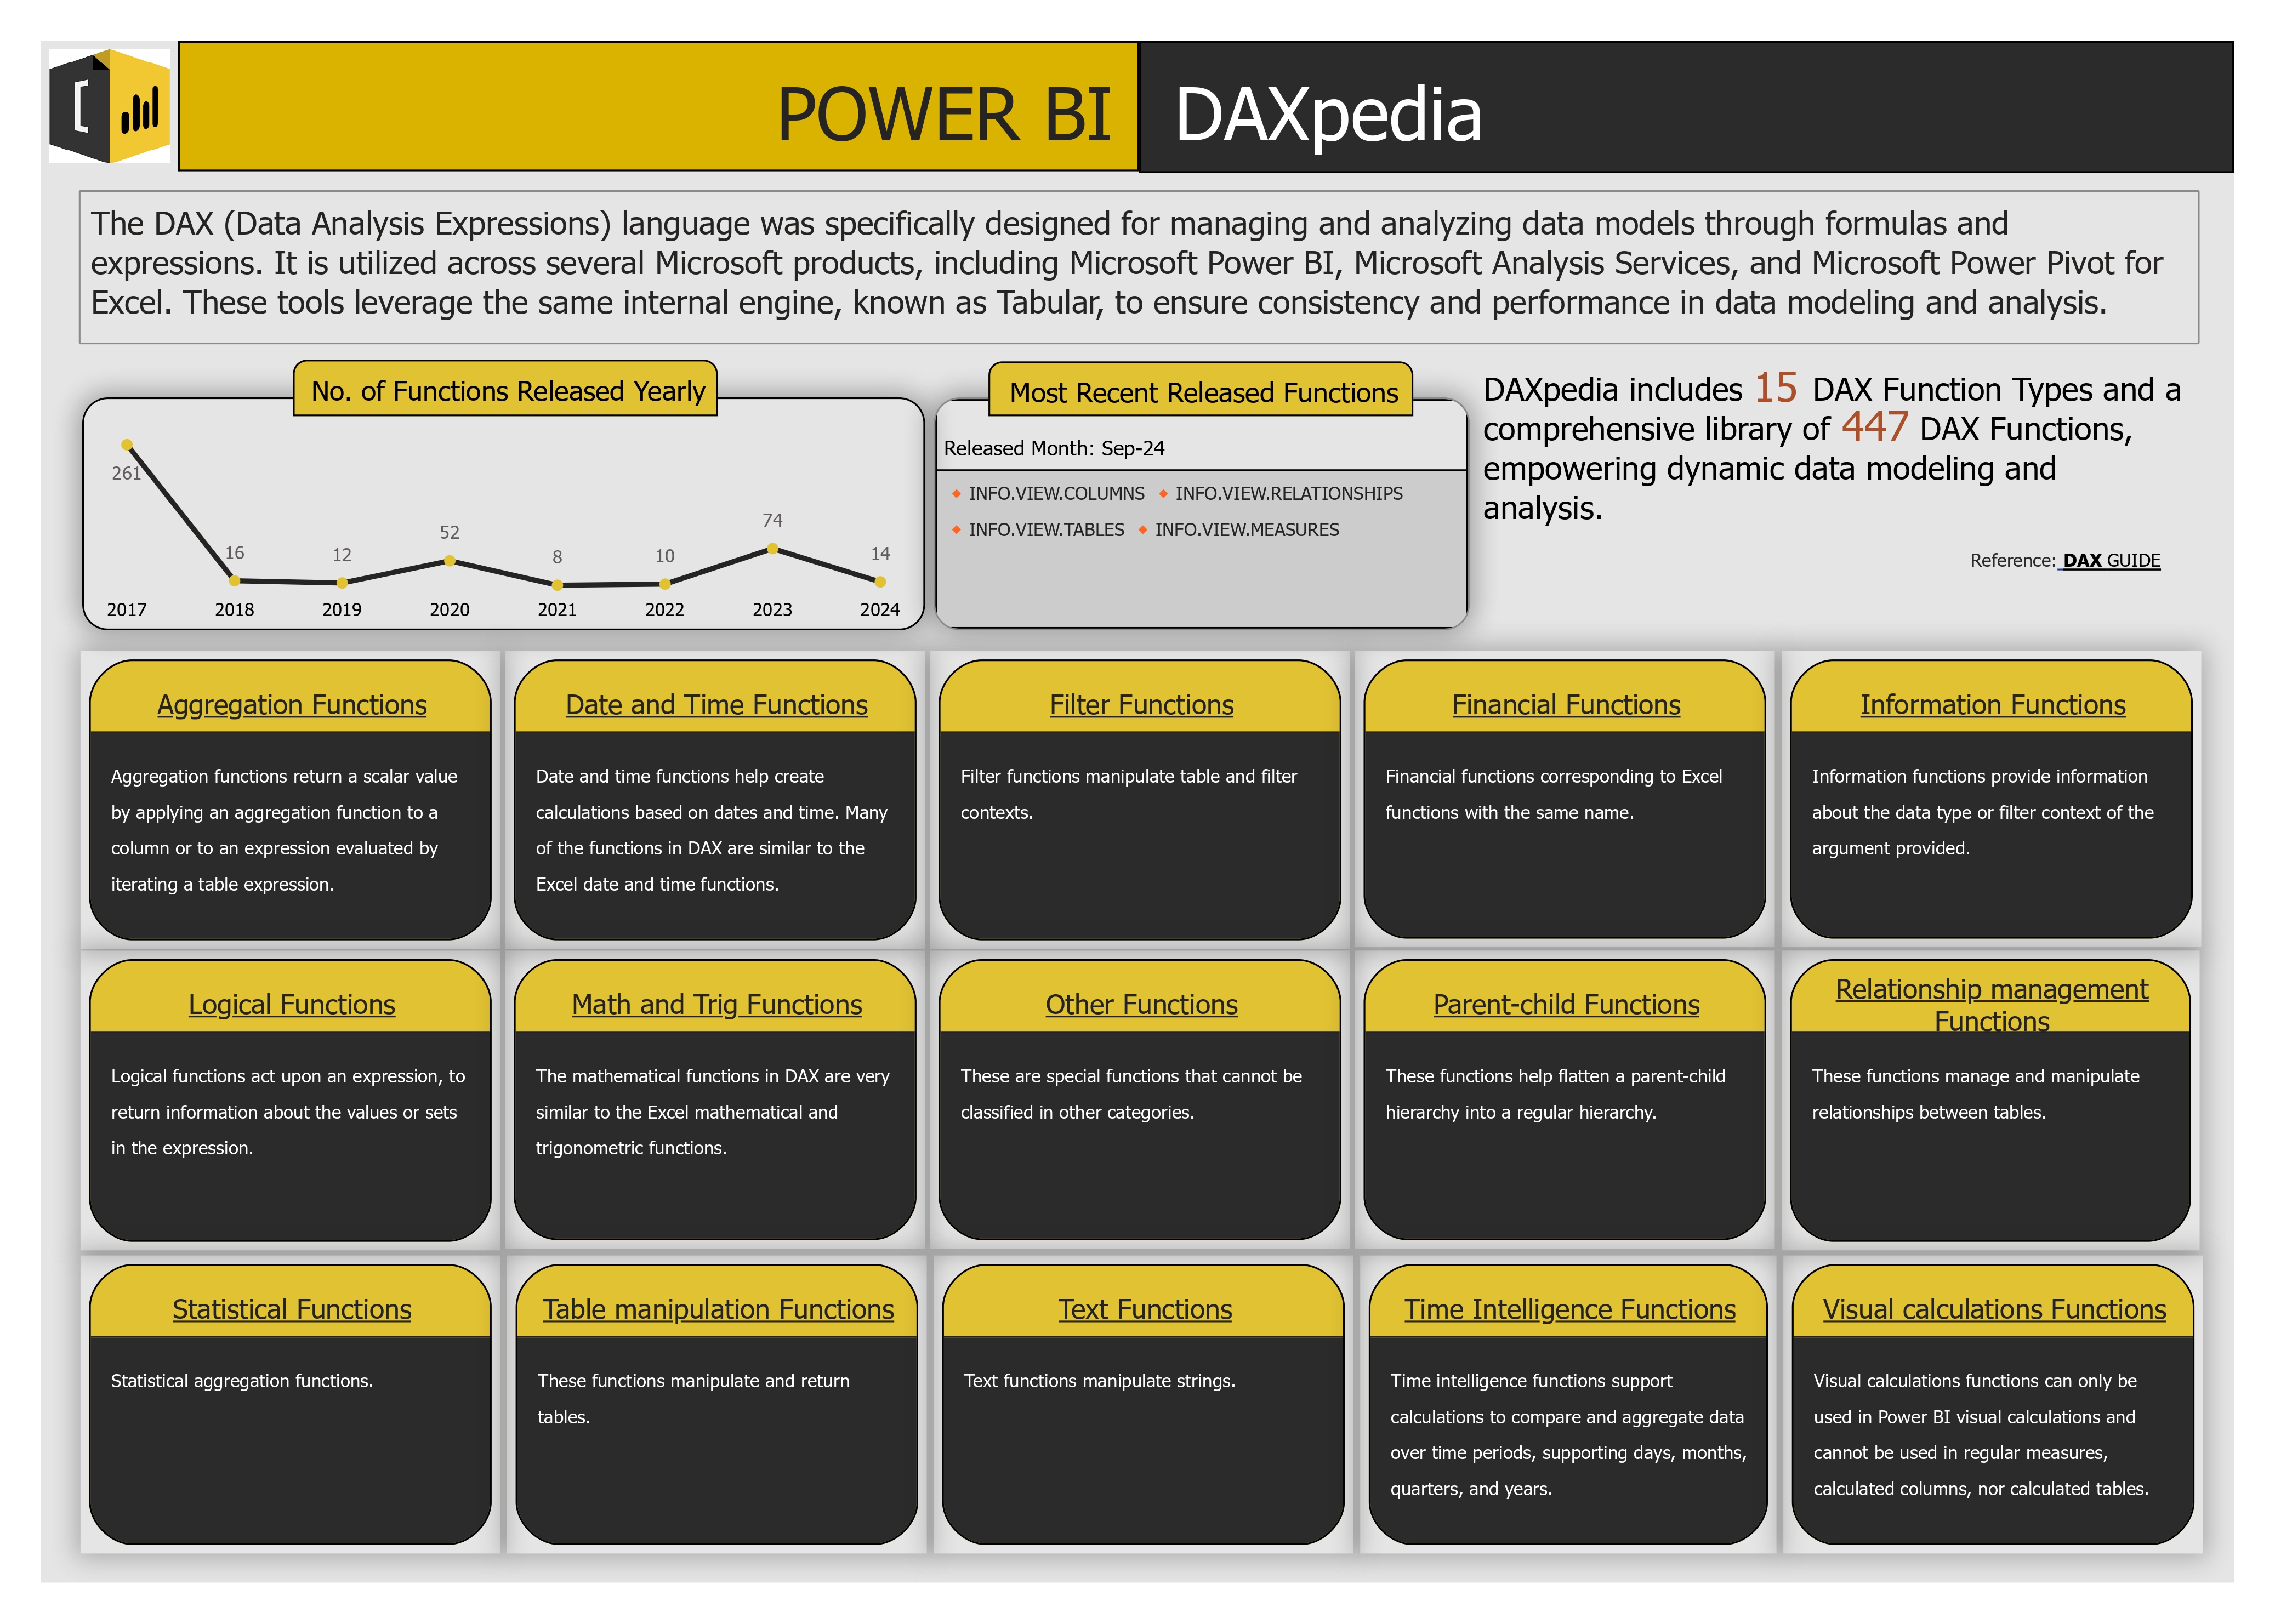
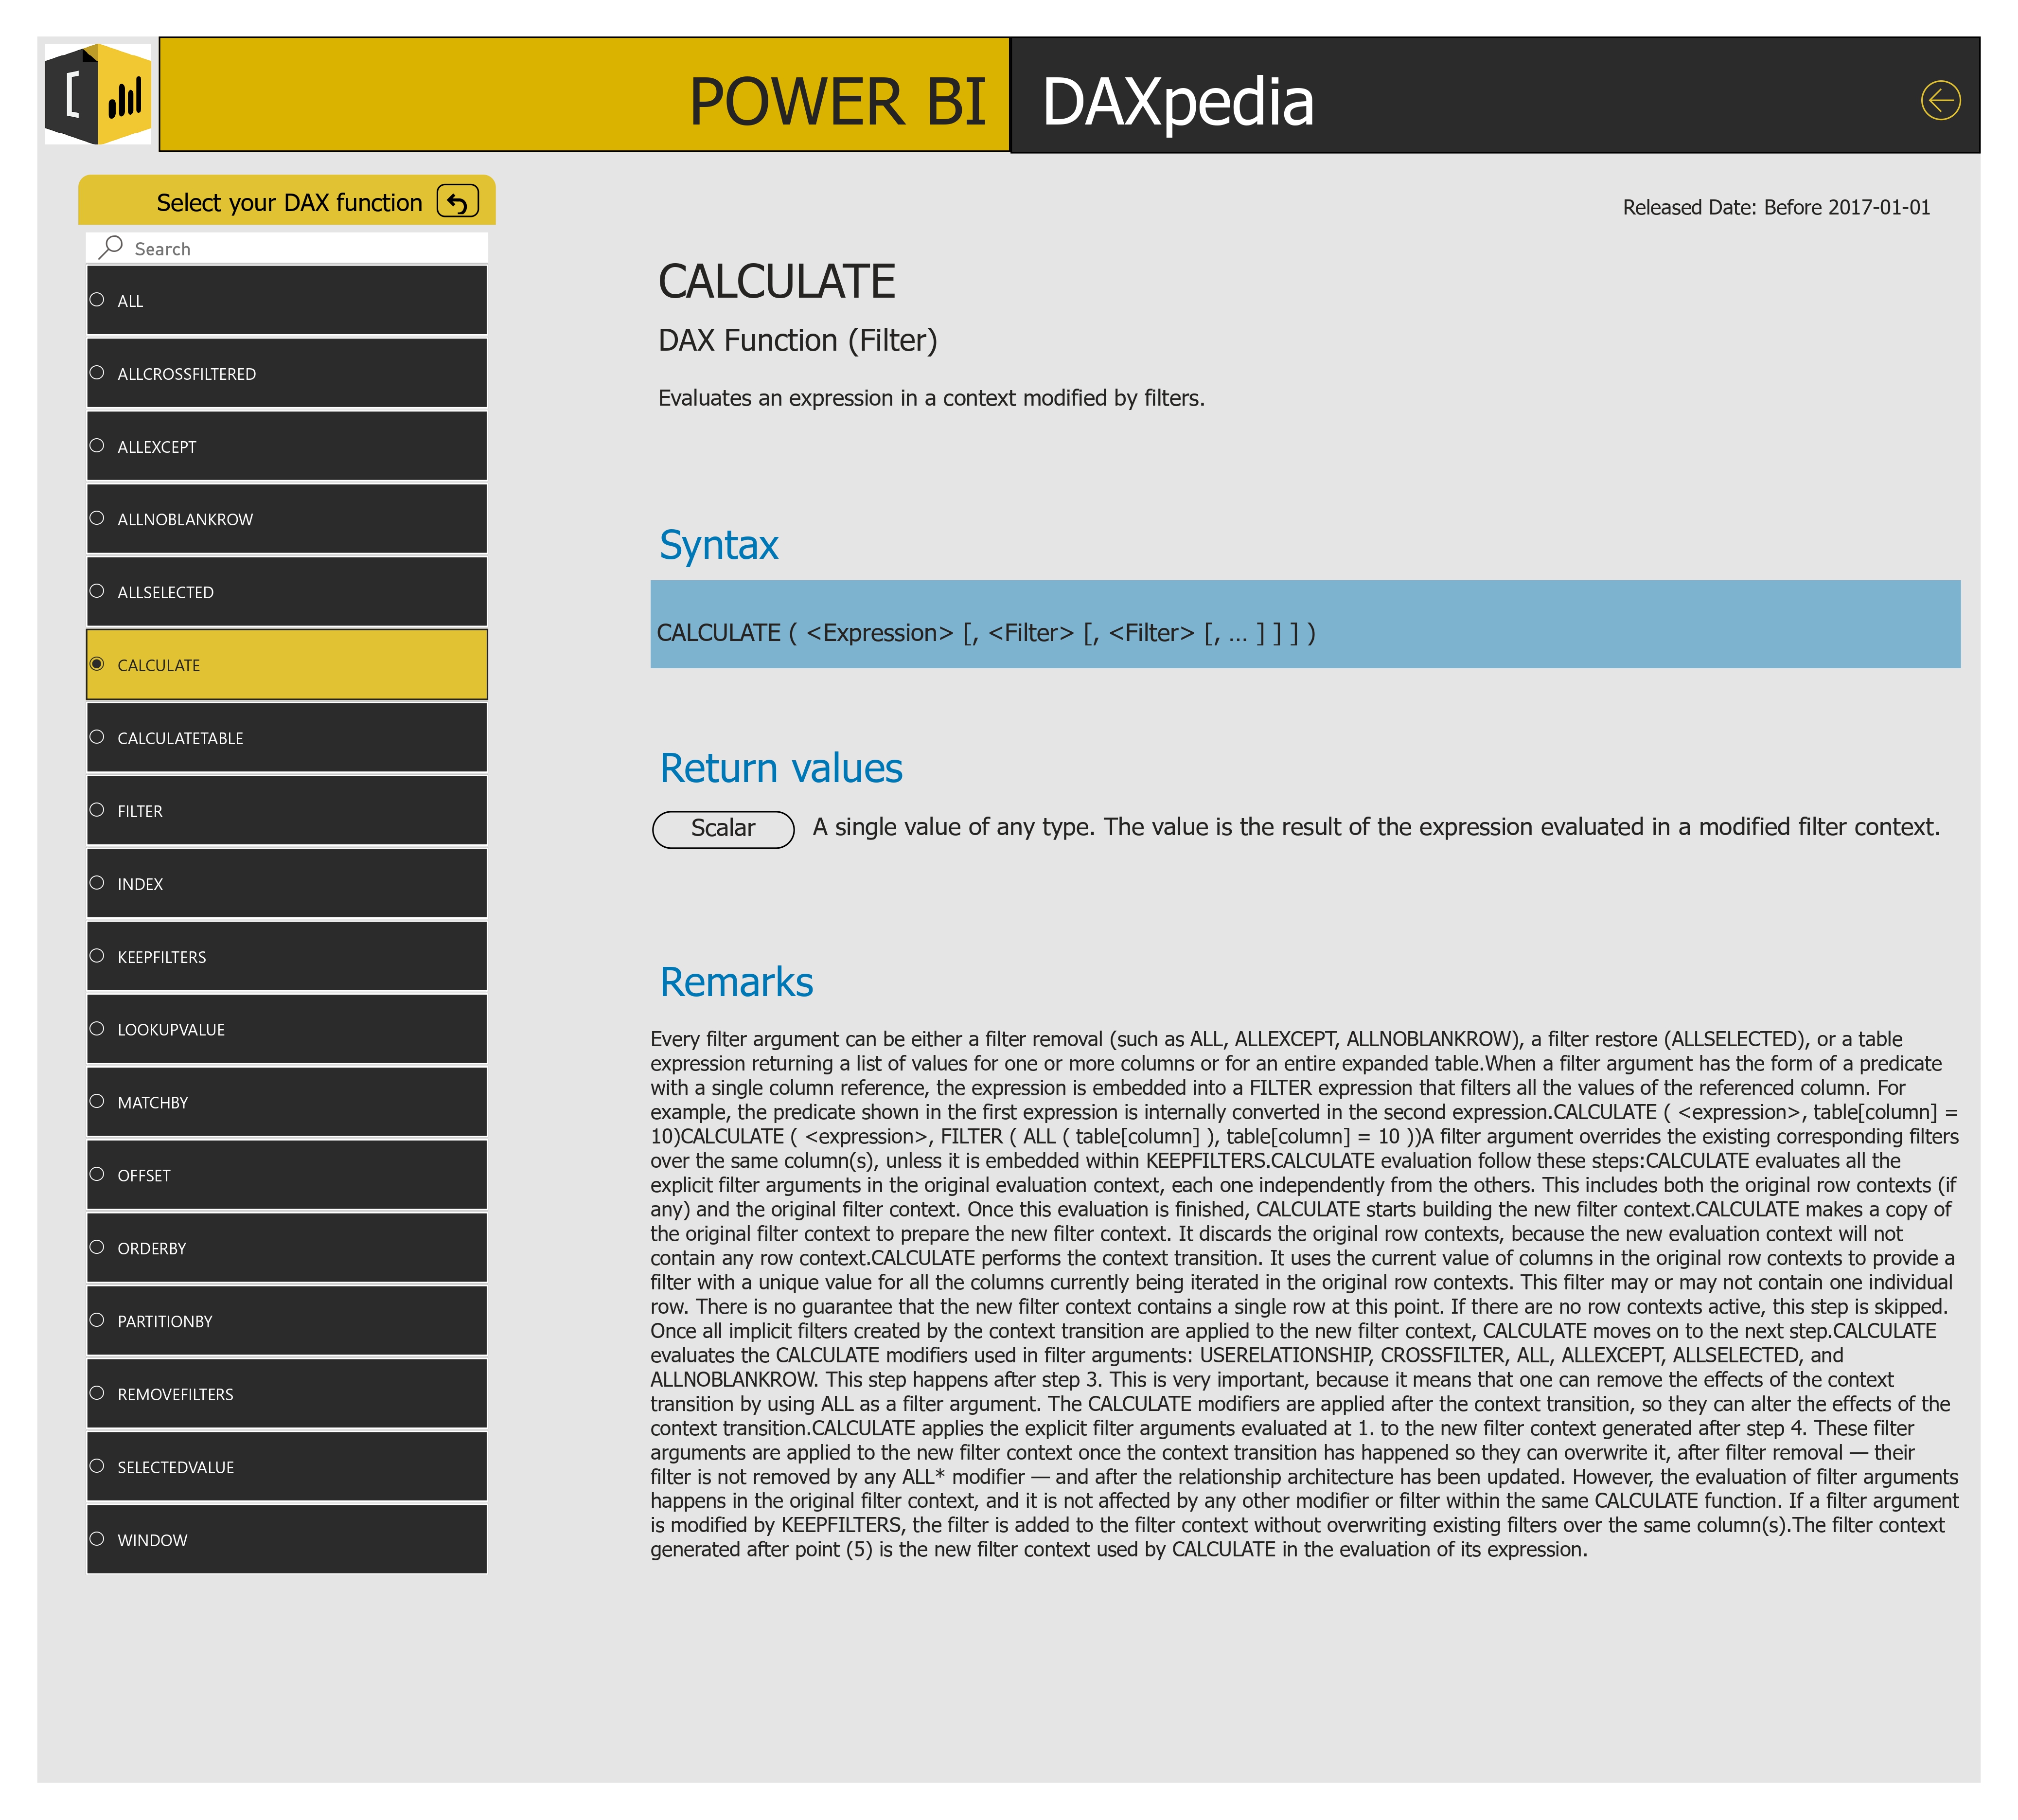
The DAX Quick Guide
Developed DAX Cheat Sheet Dashboard built in Power BI, utilizing Power Query to dynamically fetch DAX function metadata from the dax.guide portal.
⭐ Key Features
- Live data source from dax.guide
- Category-wise function breakdown (e.g., Aggregation, Logical, Time Intelligence)
- Dynamic filtering with Manage Parameters
- Year-wise release tracking of DAX functions
- Tooltips and descriptions for quick reference
- PDF Export included
🛠️ Tools & Technology Used
- Power BI: For building data models, visuals, and DAX calculations
- Power Query: Used M Language, parameters and custom functions to fetch data from the website.
Portfolio Details
Streamlined data processes to support data-driven decisions.
Project Information
- Name: Shift Analysis Reports Automation
- Category: Reporting & Automation
- Project URL: View on Github
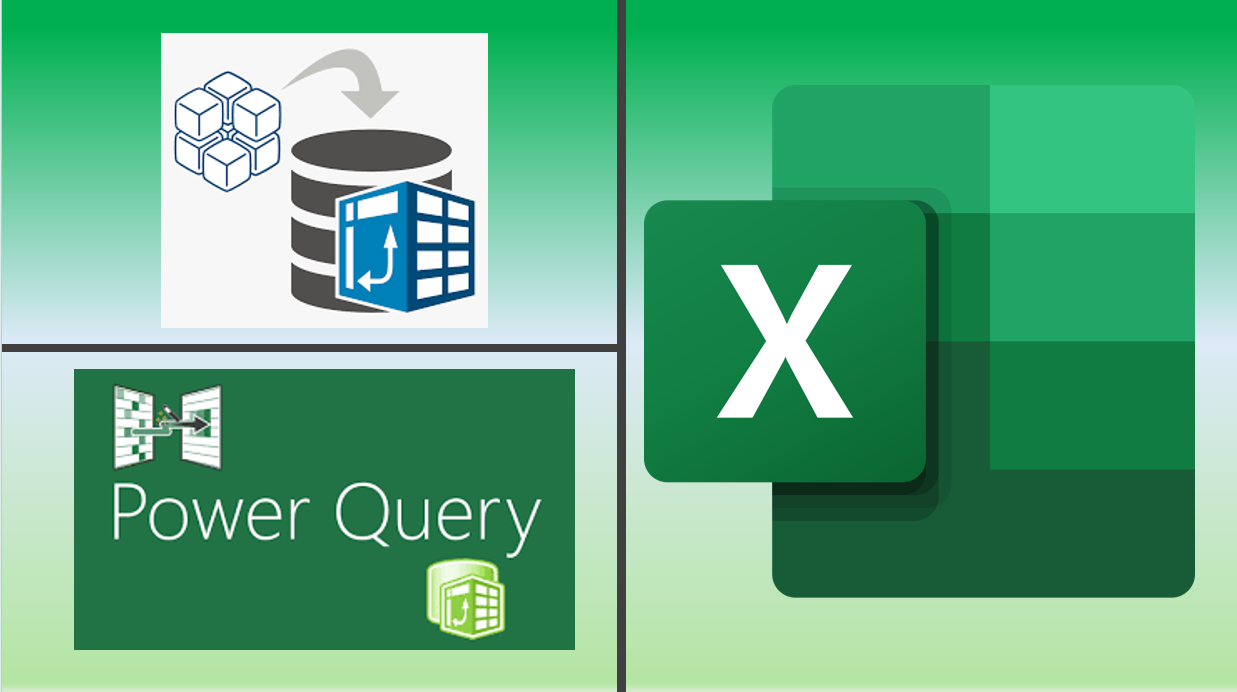
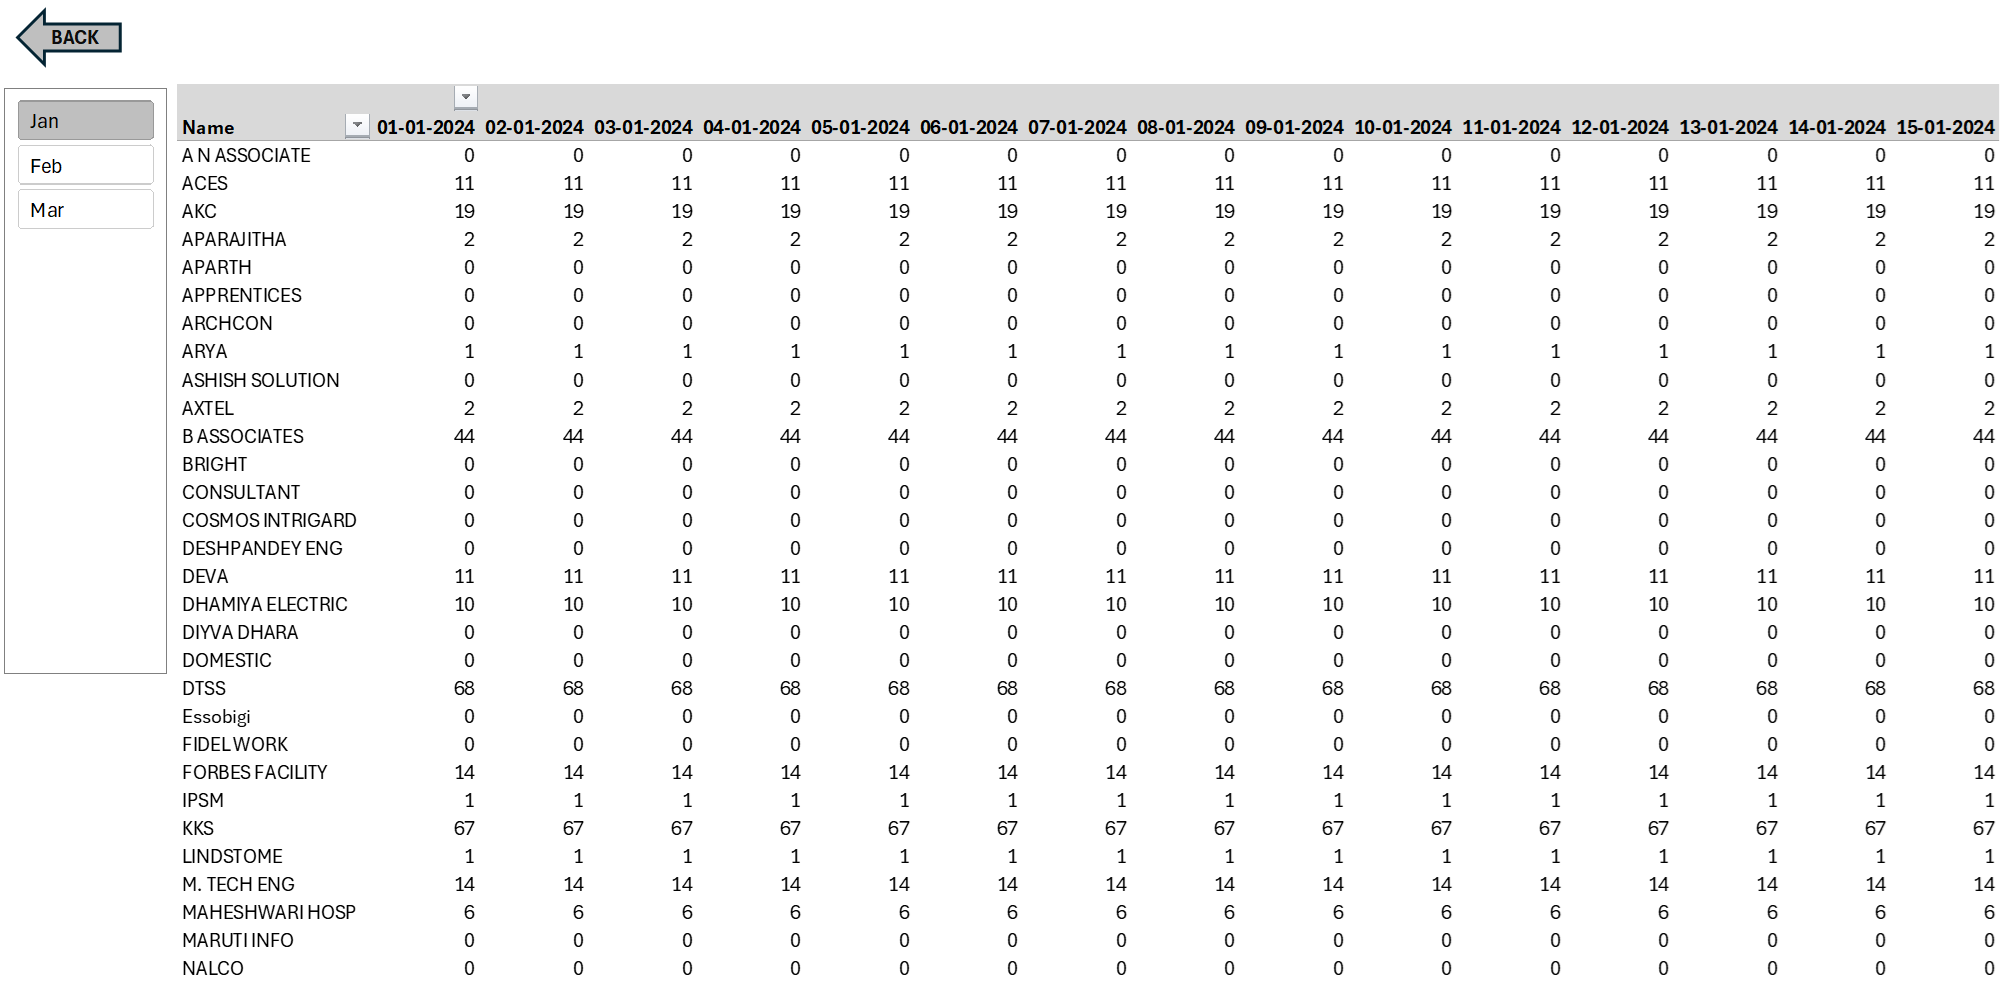
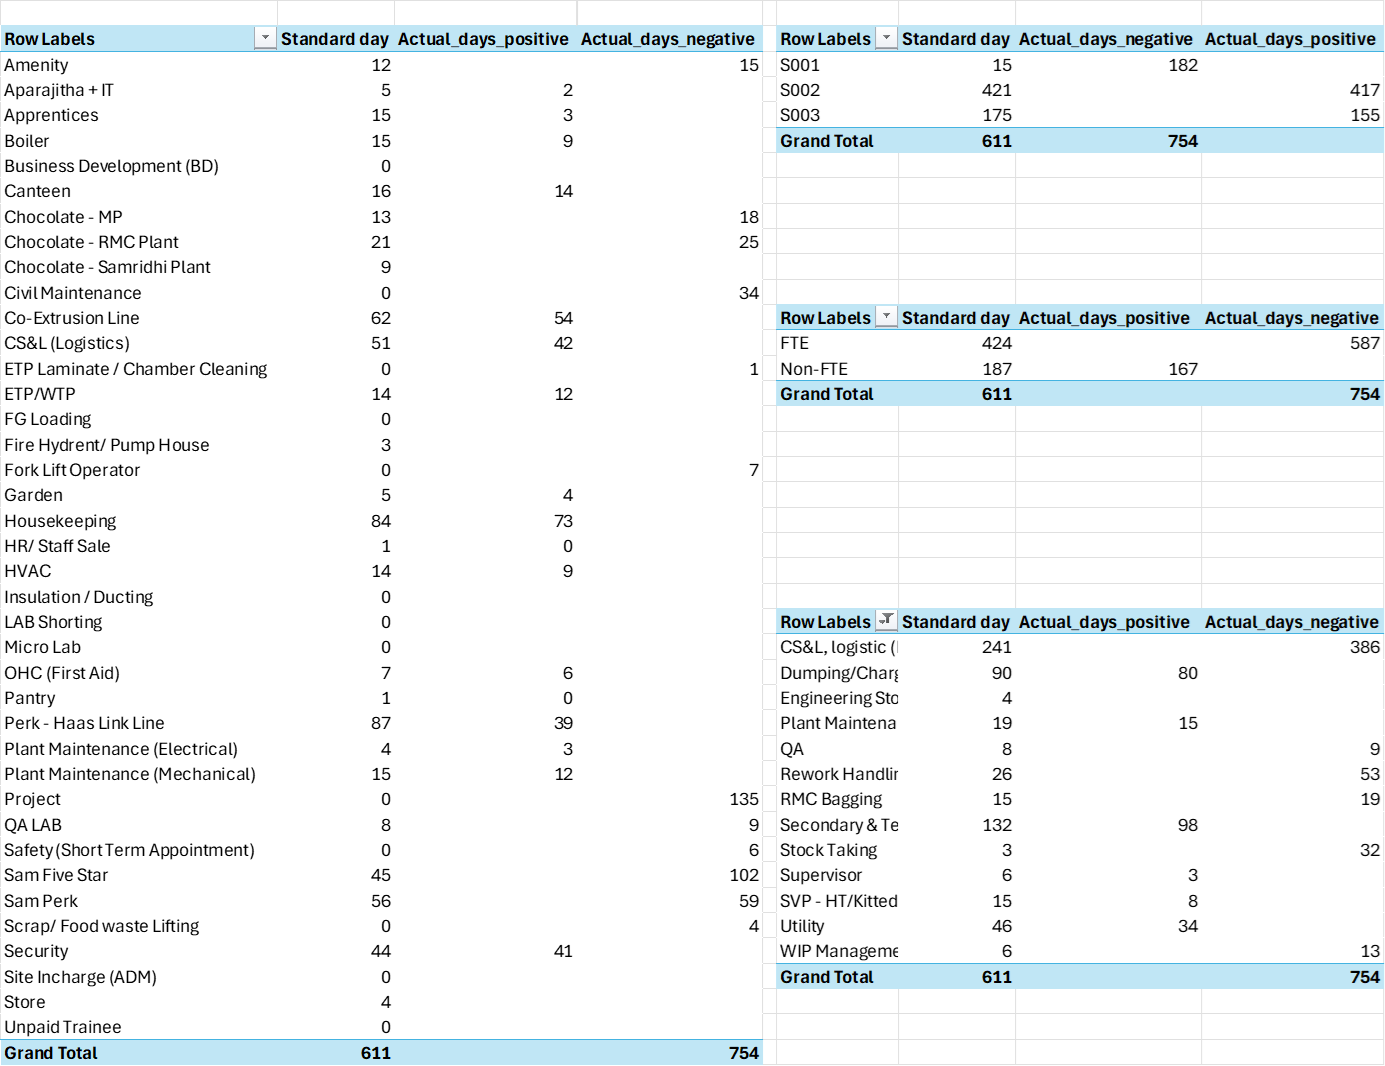
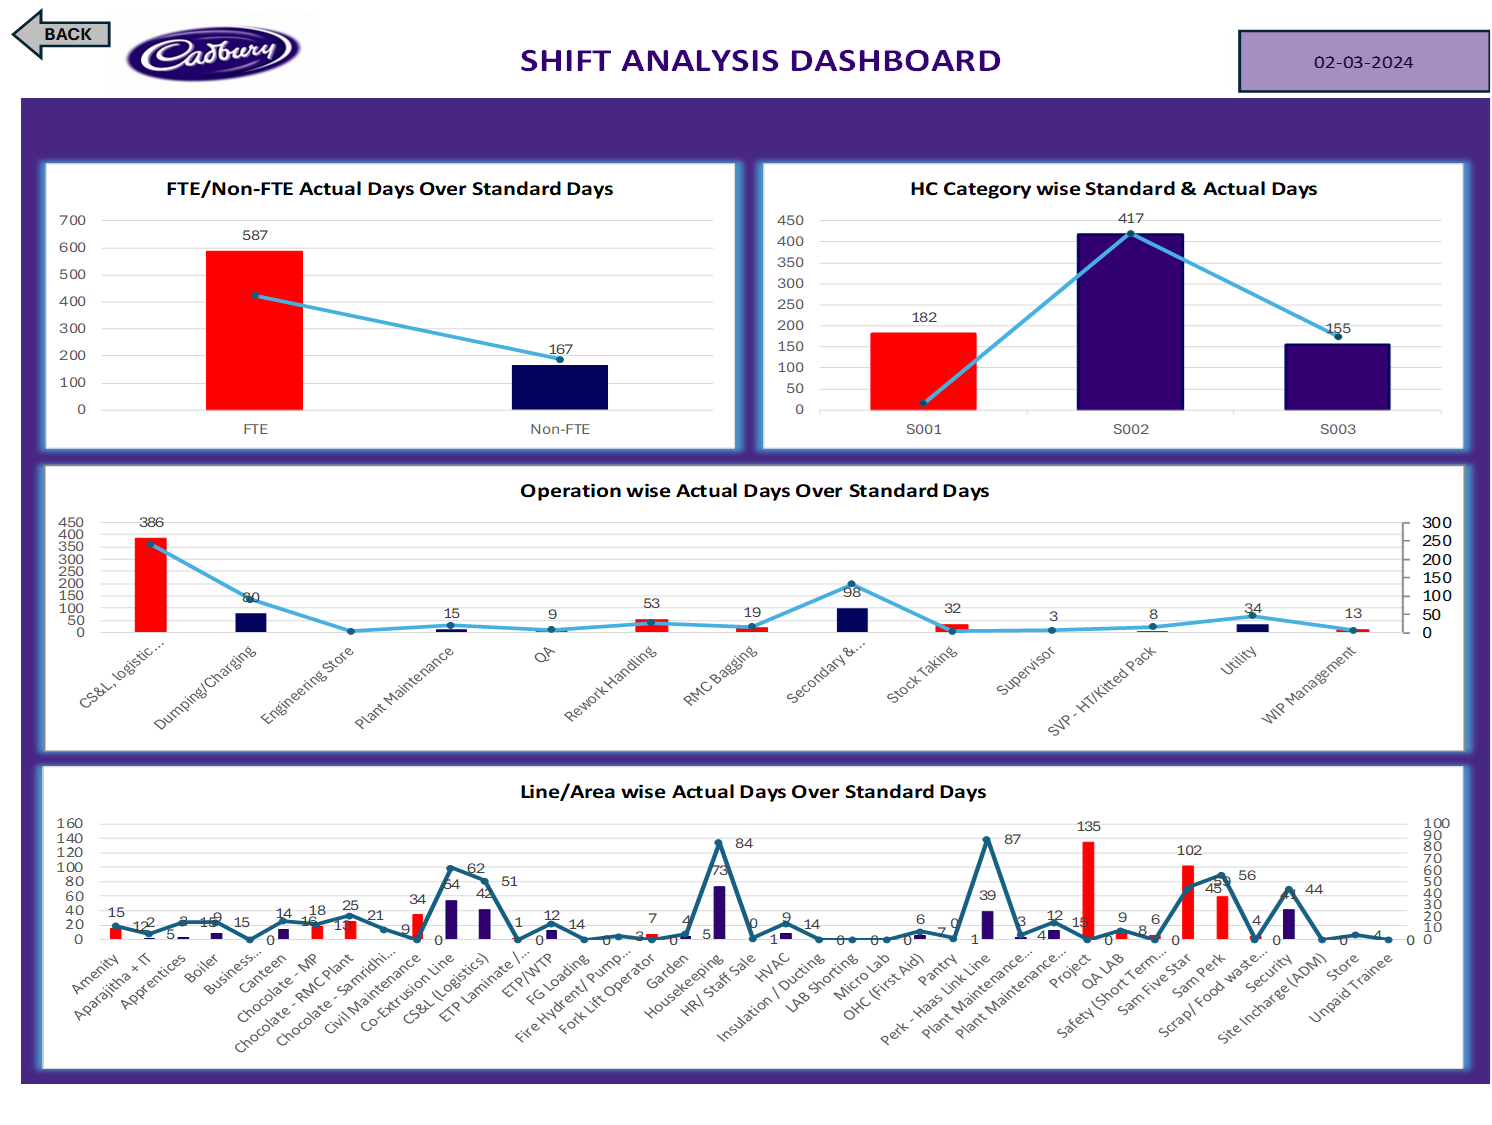
Shifts Reporting Summary
Automated a shift reporting system that consolidates data from multiple files, summarizes it monthly, and generates an interactive Excel dashboard.
🛠️ Tools & Technology Used
- Microsoft Excel: For dashboard development and data presentation.
- Power Query (M Language): For ETL (Extract, Transform, Load) operations.
- Power Pivot: For DAX-based calculations and modeling.
- VBA (Visual Basic for Applications): For automation and interactivity.
- Pivot Tables & Charts: For trend analysis and performance tracking.
Portfolio Details
A structured SQL case study designed to develop efficient, scalable queries for customer behavior analysis and loyalty insights.

Project Information
- Name: Danny's Diner Business Case Study
- Category: SQL Development
- Project URL: View on Github
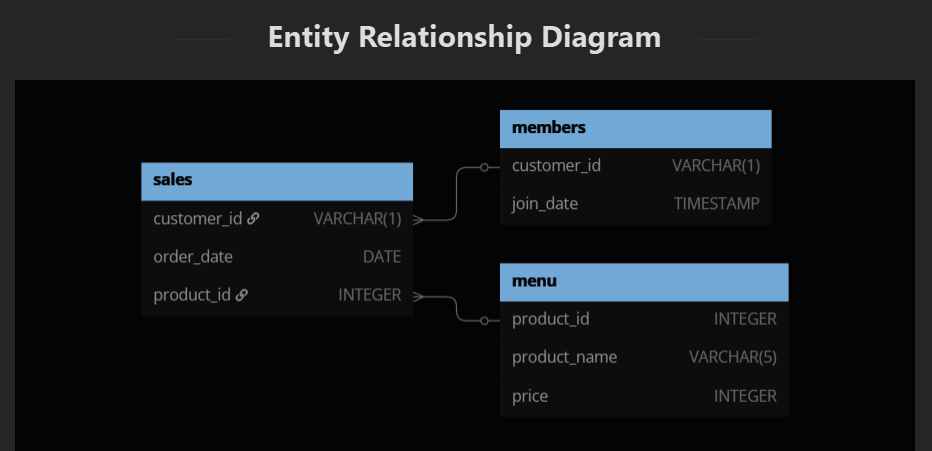
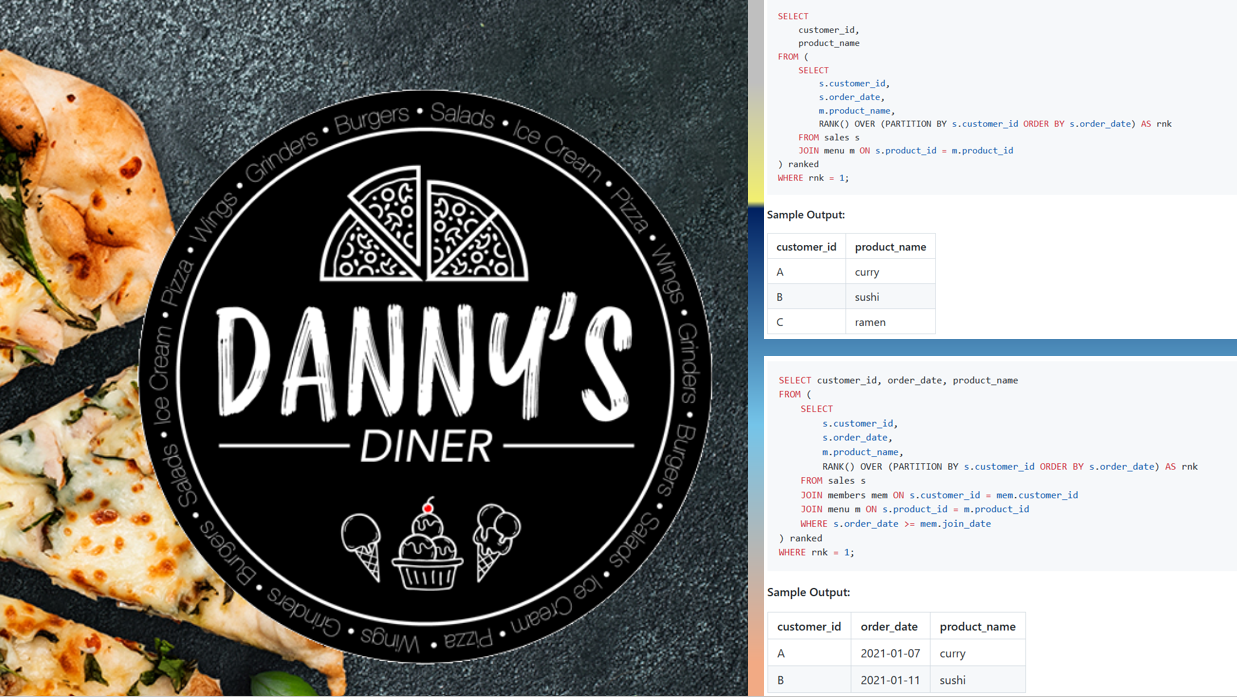
Danny’s Diner SQL Case Study
Analyzed customer purchasing behavior and sales performance using structured SQL queries across relational datasets representing a fictional restaurant’s transactions, membership program, and menu.
⭐ Key Features
- End-to-end analysis using 12 business-driven SQL queries.
- Joins, CTEs, window functions, and date filtering techniques.
- Customer segmentation based on loyalty and visit frequency.
- Item popularity analysis by customer and overall.
- Custom point-based loyalty calculation logic.
- Well-documented output with query-based storytelling.
🛠️ Tools & Technology Used
- Microsoft SQL Server DBMS.
- SQL (CTEs, aggregations, window functions).
Portfolio Details
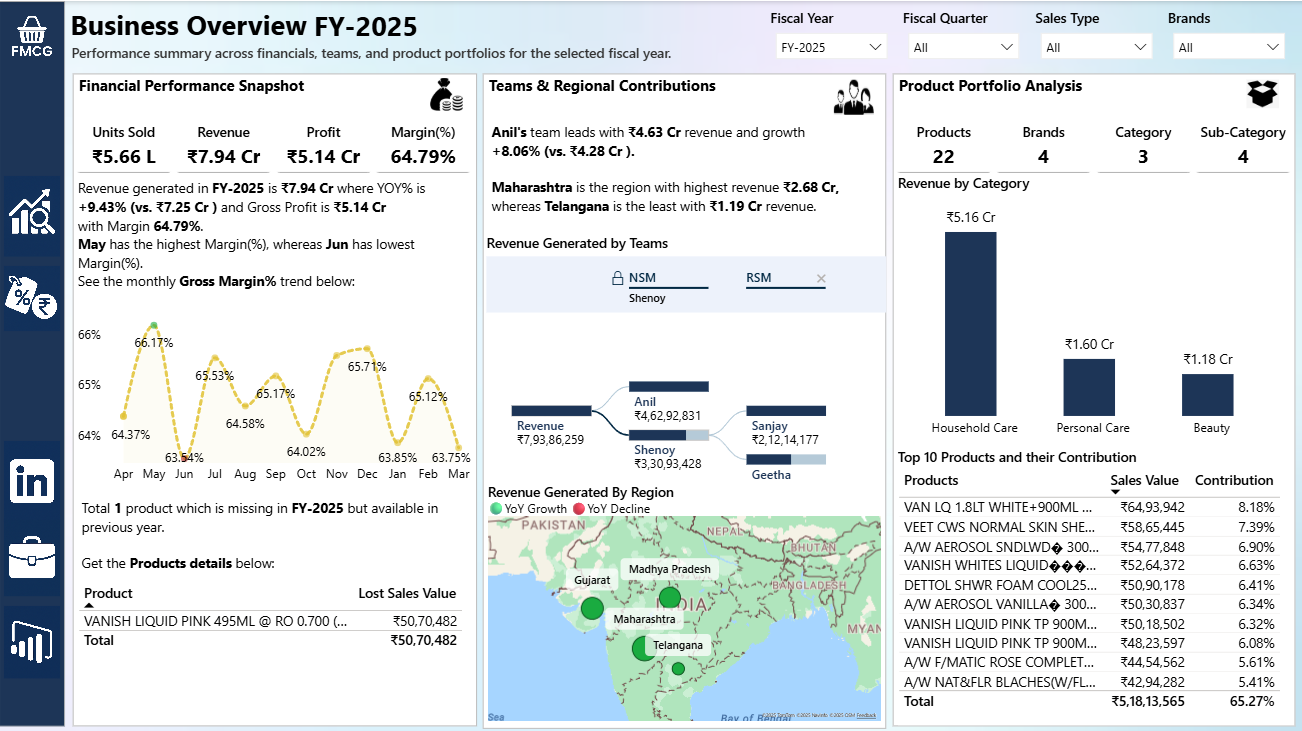
A data-driven promotional effectiveness dashboard for a FMCG (Fast-Moving Consumer Goods) business to optimize trade promotions and profitability.
Project Information
- Name: Goodly FMCG Case Study
- Category: Power BI Development
- Project URL: View on Github
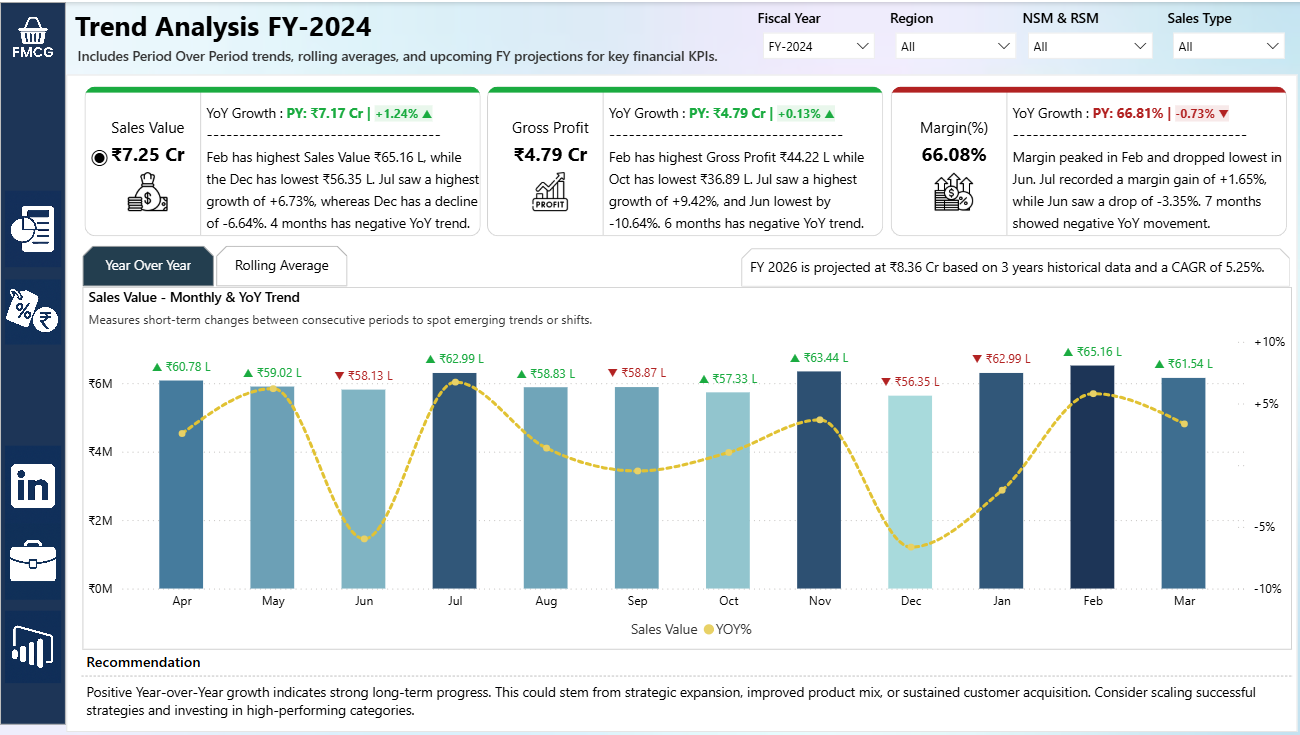
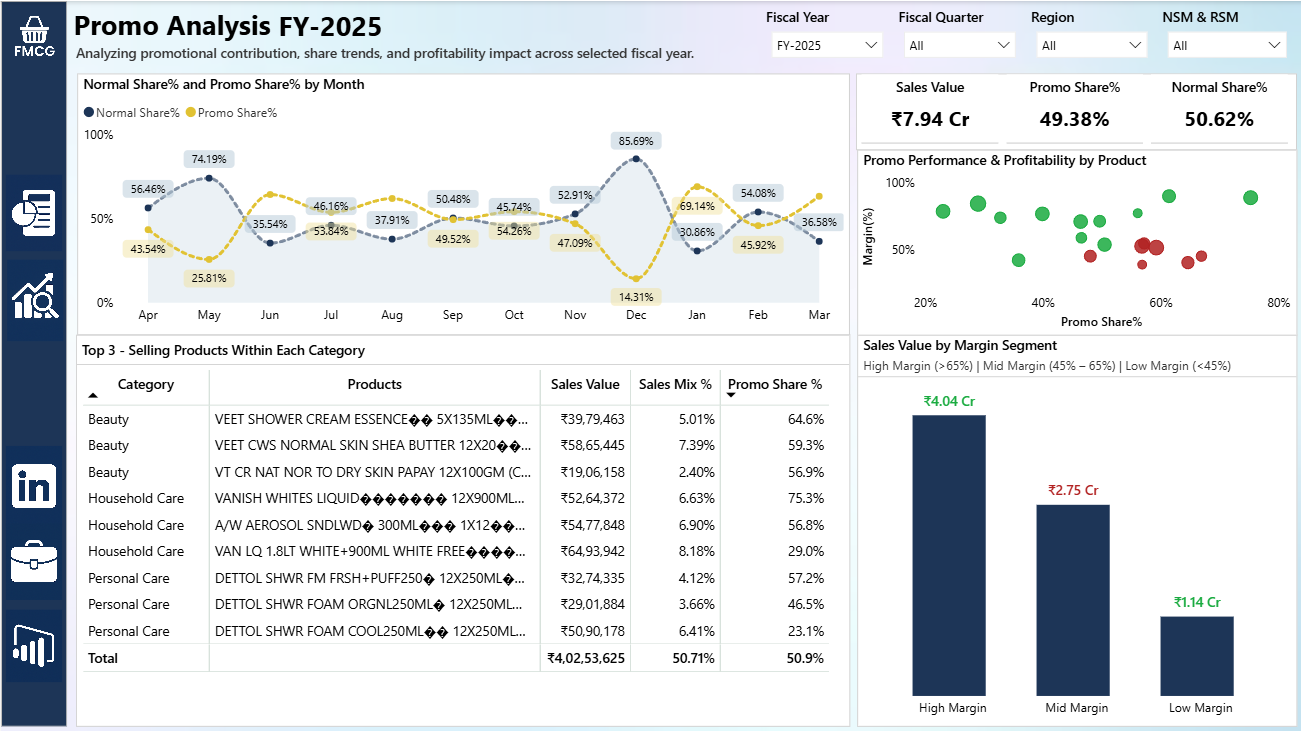
FMCG Power BI Case Study
Power BI dashboard for an FMCG distributor, tracking sales KPIs, promotions, margins, and regional trends for the National Sales Head and regional teams.
⭐ Key Features
- CAGR to project upcoming FY KPI Values (Sales, Gross Profit, Gross Margin%).
- Auto-updating text summary based on KPI and time filters
- Supports natural language queries like "top region by sales"
- Identifies over-discounting via scatter visual
- Enables RSM/NSM level drilldowns
- Highlights missed opportunities from dropped products
🛠️ Tools & Technology Used
- Microsoft Excel
- Power Query Editor
- Power BI
Portfolio Details
A data-driven project for an eCommerce business to optimize keyword visibility and product performance across different eCommerce online platforms, using Python automation, SQL integration, Excel processing, and Power BI reporting.

Project Information
- Name: Yogabar Share of Search
- Category: BI Development
- Project URL: View on Github
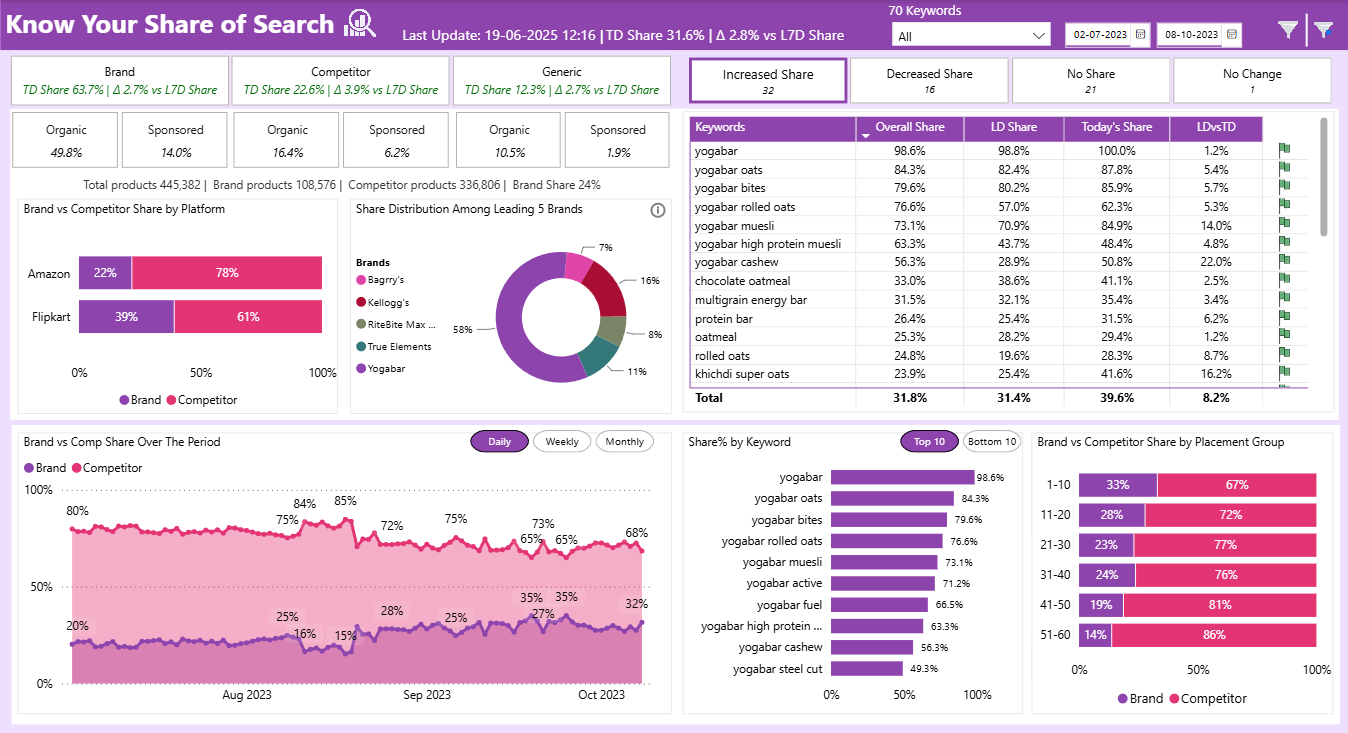
Ecommerce Share of Search
Power BI dashboard for tracking online keyword visibility and product placement performance of Yogabar across Amazon and Flipkart—powered by automated Python web scraping, SQL-based data integration, and Excel exports—designed for brand managers, growth teams, and digital marketing leads.
⭐ Key Features
- End-to-end automation: Web scraping (Selenium), Excel export, SQL push, and Power BI reporting
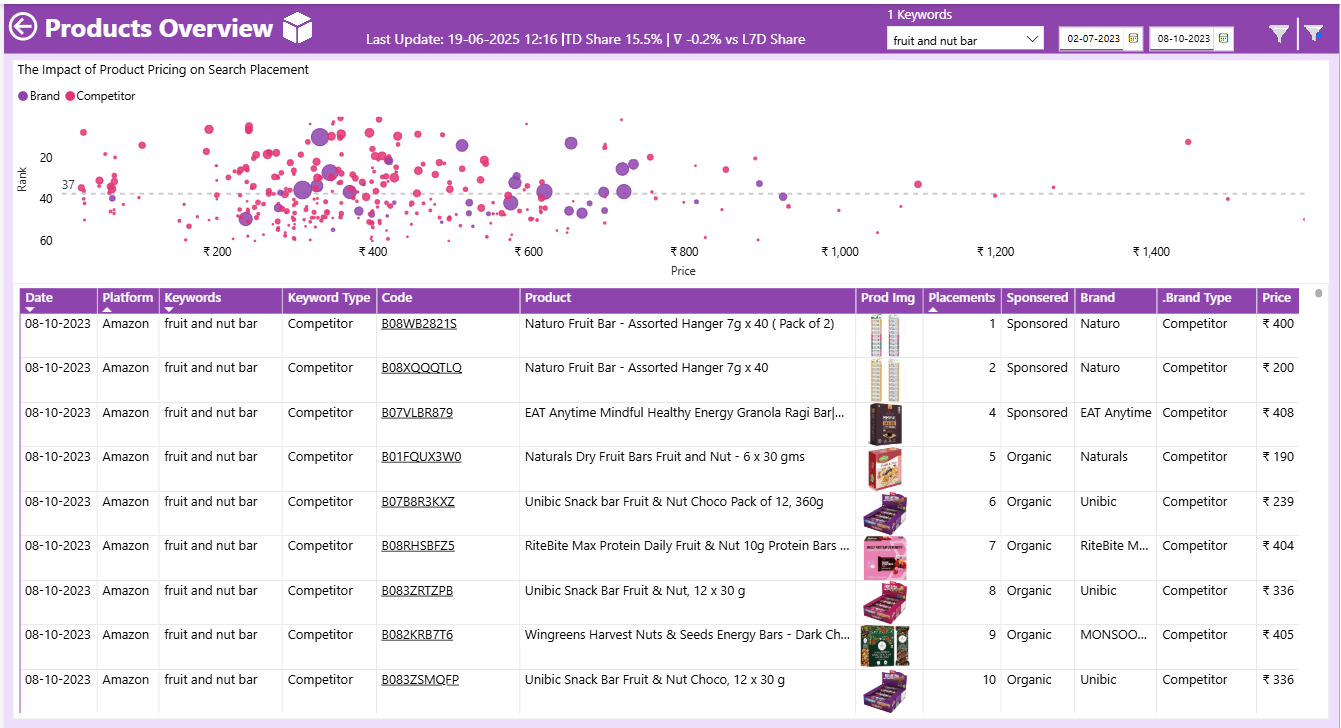
- Trendlines with correlation between price and product rank
- Drillthrough to ASIN-level insights and rank change tracking
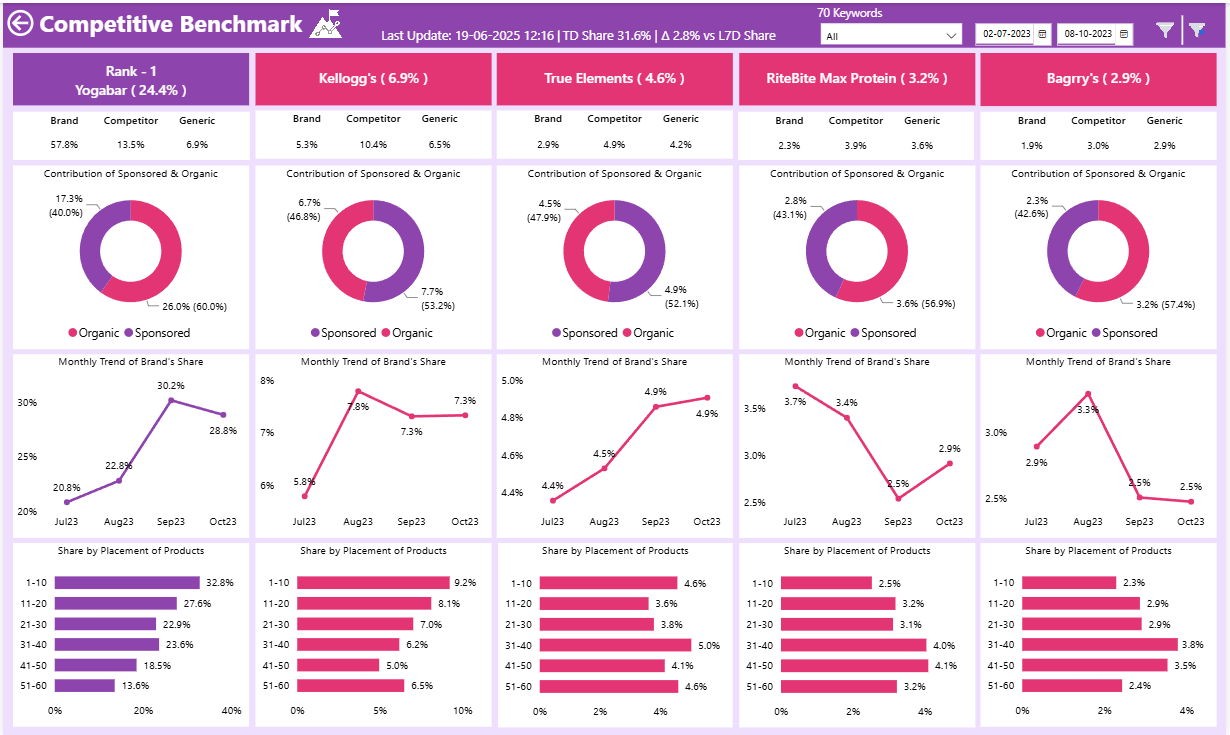
- Competitive benchmarking across platforms and placements
- Auto-summarized insights with performance change indicators
🛠️ Tools & Technology Used
- Python (Selenium, Pandas, sqlalchemy)
- Microsoft Excel
- MS SQL Server / Azure Data Studio
- Power Query Editor
- Power BI (DAX, Bookmarks, Drillthrough)
Portfolio Details
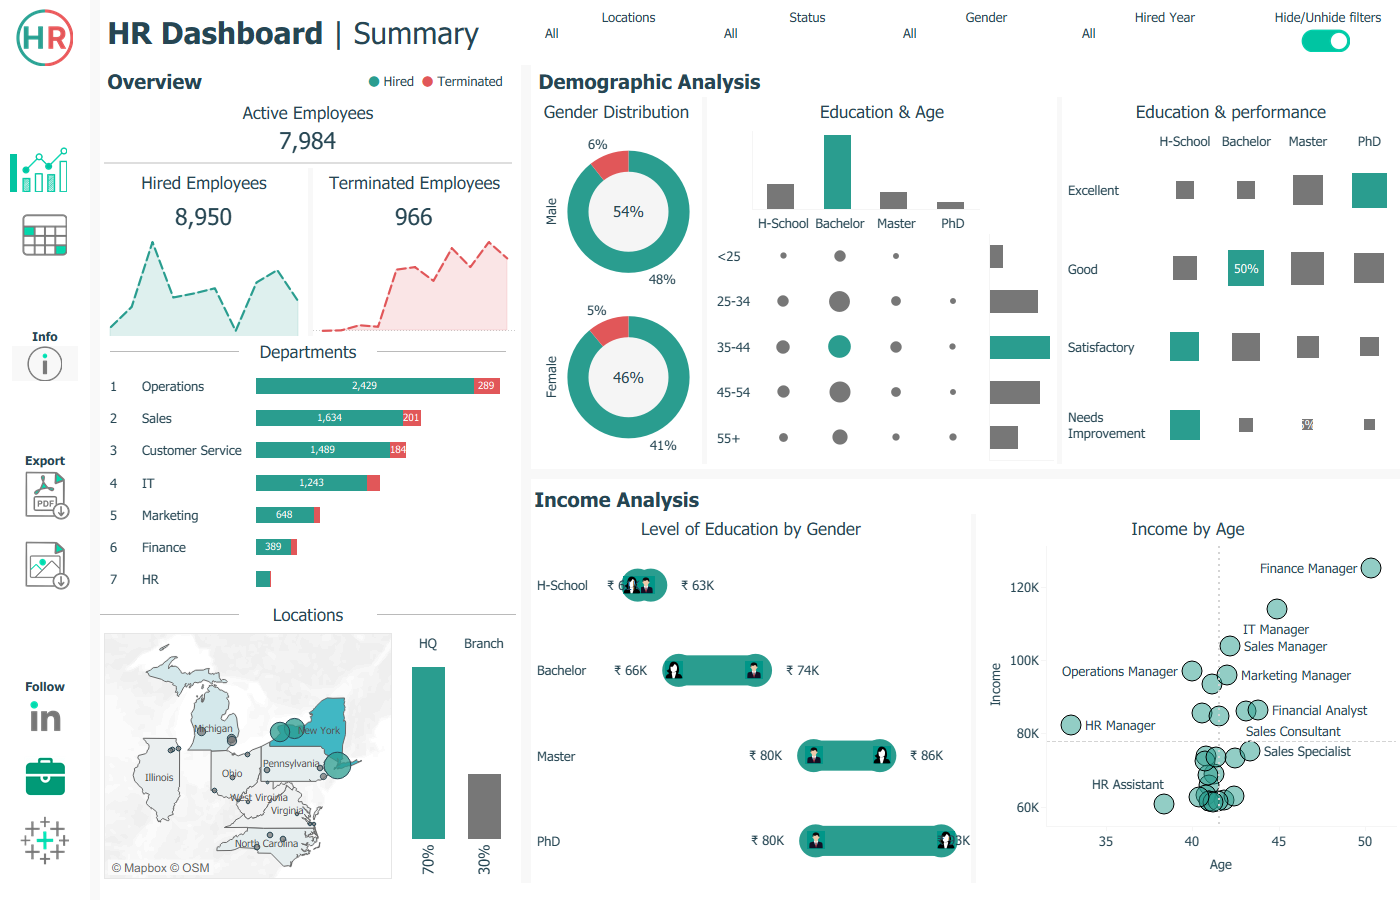
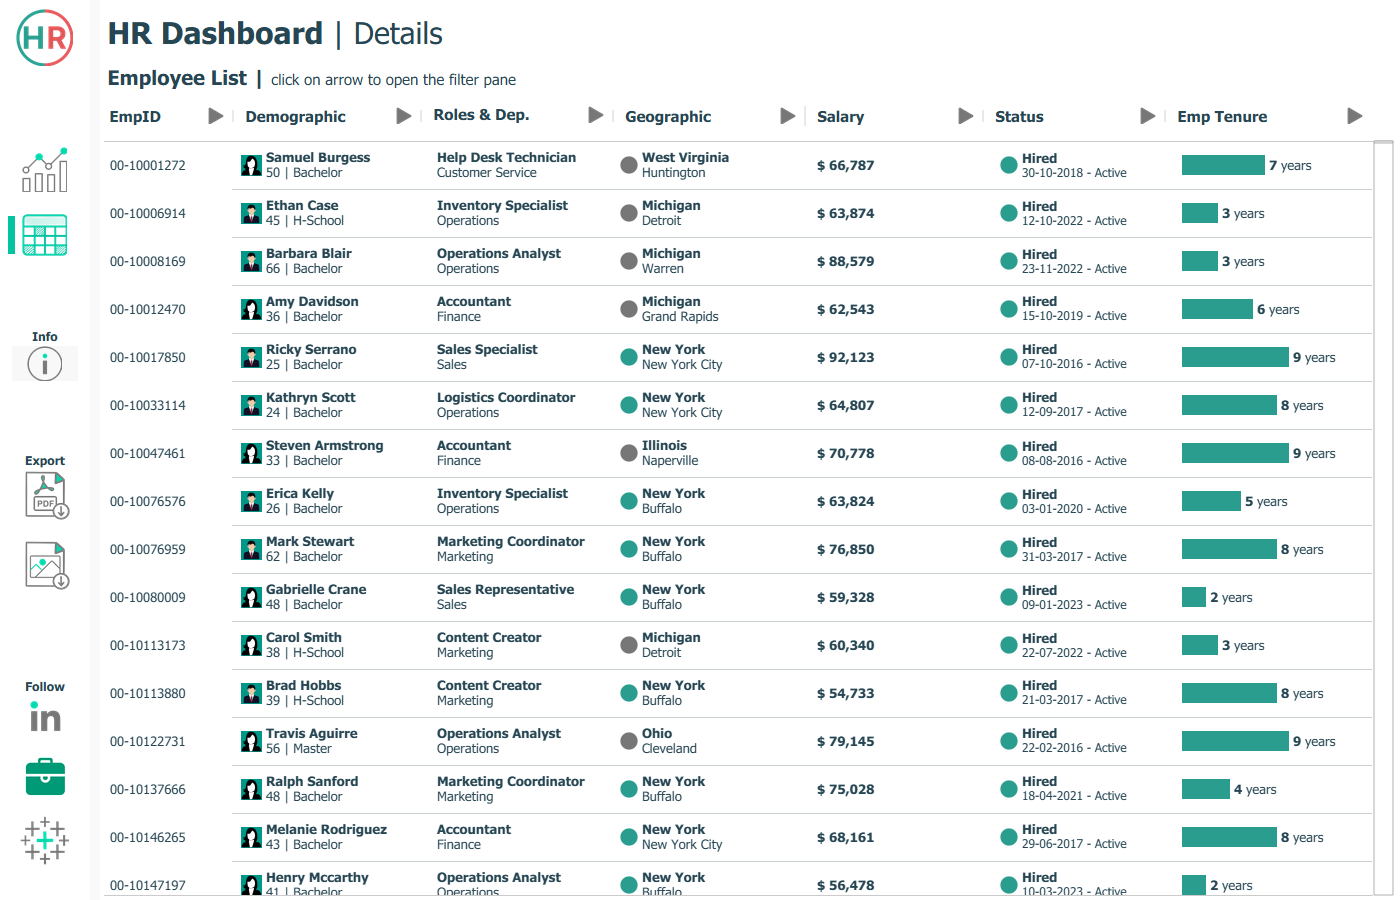
A visual analytics solution built in Tableau to help HR managers track workforce trends, analyze employee demographics, and compare salaries. It includes a summary dashboard for high-level insights and a detailed view for filtering and reviewing individual employee records.


Project Information
- Name: HR Analysis Dashboard
- Category: Tableau Development
- Project URL: View on Github
Human Resource Analysis
An interactive Tableau dashboard that provides HR managers with a summary of workforce metrics, such as hiring trends, demographics, and salary analysis—alongside a detailed, filterable employee record view for in-depth analysis.
⭐ Key Features
- Interactive summary view showing total hired, active, and terminated employees
- Department-wise employee distribution and attrition analysis
- Gender, age group, and education-level demographics visualization
- Performance rating insights by educational background
- Salary comparison across gender and education levels
- Age vs. salary analysis by department using scatter plots
- Filterable detailed employee records table with key attributes
🛠️ Tools & Technology Used
- Tableau Dashboard development and data visualization.
- Excel / CSV Data source files.
- PowerPoint / Figma for Dashboard wireframe design.
Portfolio Details
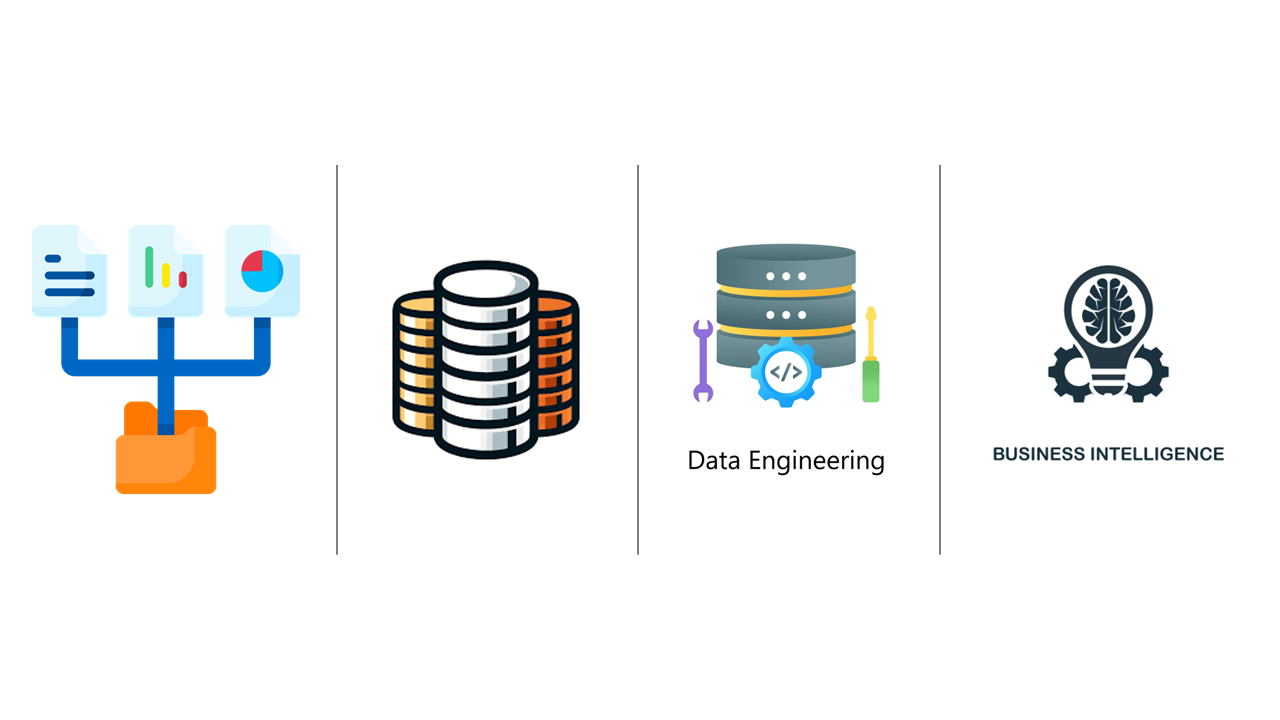
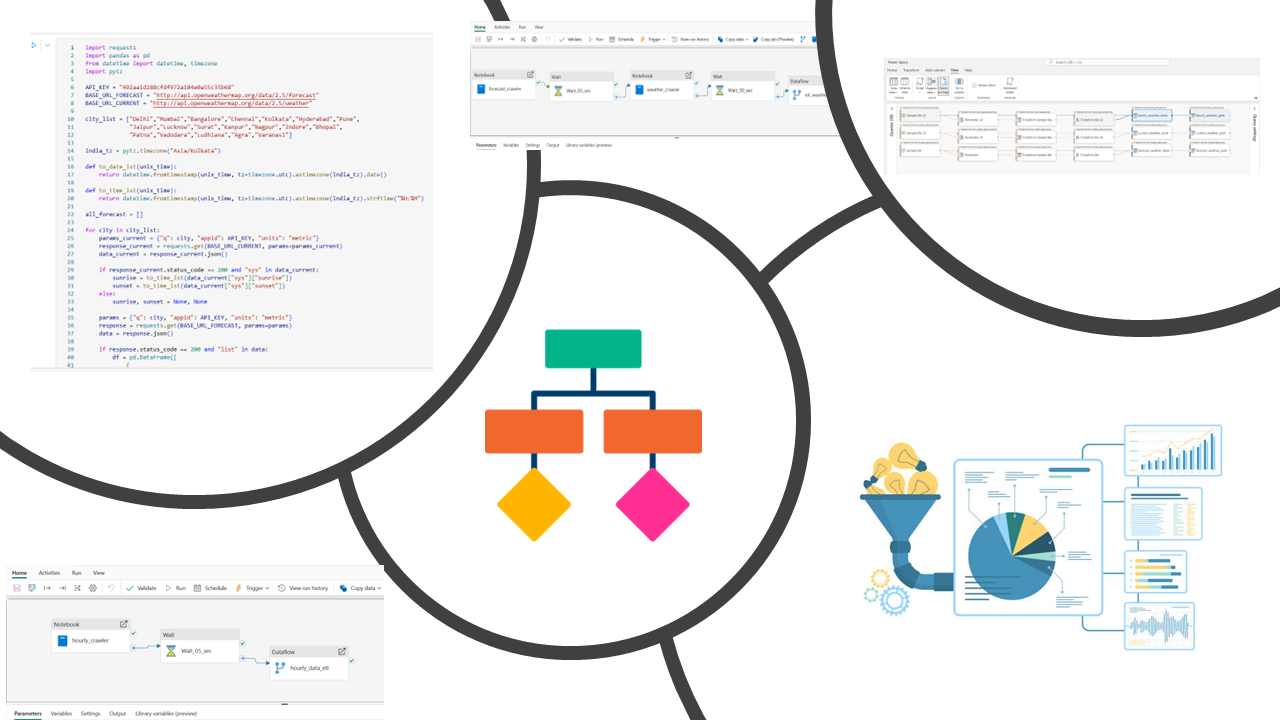
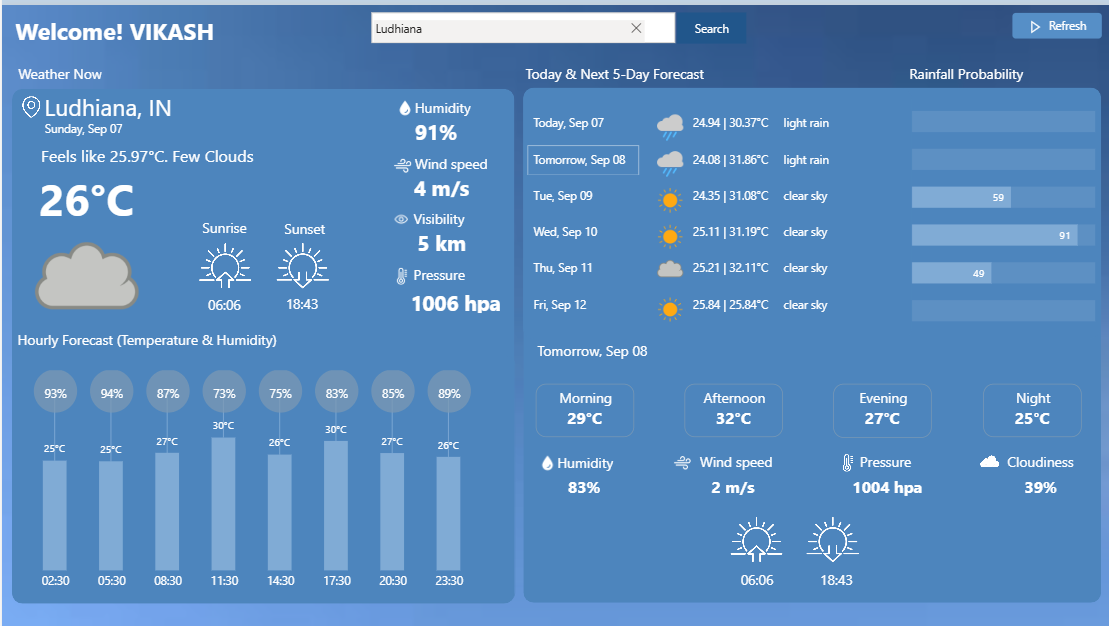
An end-to-end Weather Forecast Analysis solution using Microsoft Fabric Medallion Architecture, automating data ingestion, transformation, and daily updates. Delivered a real-time Power BI dashboard with on-demand refresh powered by Power Automate.
Project Information
- Name: Weather Forecast Analytics
- Category: Data Engineering & BI Development
- Project URL: View on Github
SkyCast - Weather Analytics Powered by MS Fabric
Developed an end-to-end Weather Forecast Analysis project using Microsoft Fabric Medallion Architecture, automating data pipelines from API to dashboard. Delivered real-time insights through an interactive Power BI report with on-demand refresh powered by Power Automate.
⭐ Key Features
- End-to-end Medallion Architecture implementation (Bronze → Silver → Gold) in Microsoft Fabric
- Automated daily data ingestion from Weather API using Python Notebooks
- Data cleaning and transformation with Dataflow Gen2 for structured Silver layer
- Analytics-ready Gold tables with aggregated weather metrics (temperature, rainfall, wind, humidity)
- Interactive Power BI dashboard with forecast trends and extreme weather alerts
- On-demand refresh capability integrated via Power Automate button in Power BI
- Scalable data pipeline preserving historical weather trends for analysis
🛠️ Tools & Technology Used
- Microsoft Fabric (OneLake, Dataflow Gen2, Pipelines, Notebooks, Lakehouse, Delta Tables) for data engineering and storage.
- Python for API extraction, JSON handling, and Delta table integration.
- Power BI for interactive dashboard design, DAX calculations, and data modeling.
- Power Automate for enabling on-demand data refresh in Power BI reports.